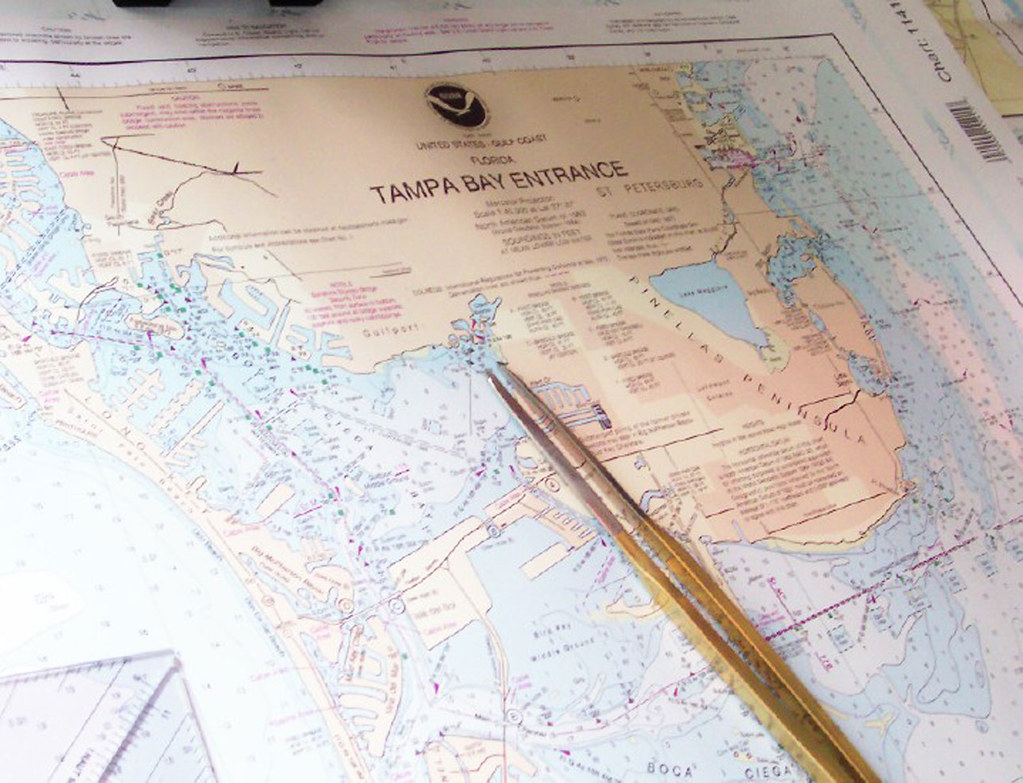
The folio sat on the saloon table of the Aldgate, a 32-foot Sabre sloop berthed at Tugboat Inn in Boothbay Harbor, weighted at one corner by a brass parallel rule and at another by a mug of cold coffee. The top sheet was NOAA chart 13293, edition 41, corrected to the latest weekly Local Notice to Mariners as of 14 March 2026.
Above it on the bulkhead, a Raymarine Axiom 9 displayed the same waters in C-MAP Reveal X, vector tiles last updated by the owner on 22 March in the marina's wifi.
Captain Eliza Trenholm had agreed to keep both running for the season's first months and to note, in a small black logbook, every instance where one chart told her something the other did not.
By the end of June she had filled forty-one pages.
Trenholm has skippered out of Boothbay since 2008 and has held a USCG 100-ton near-coastal master's license since 2013. She is not a hobbyist arguing aesthetics. She runs a small charter operation and her livelihood depends on knowing where the rocks are.
The first divergence came on the morning of 17 April, off the eastern shore of Damariscove Island. The paper chart marked a 4-fathom shoal three cables northeast of the island's southern tip. The vector chart, zoomed to the same scale, smoothed the shoal into an unmarked patch of 5-fathom water.
Trenholm took a sounding. The lead came up at 3.8 fathoms. The paper was right.
The reason, as best she could later determine, was that the C-MAP tile inherited a generalized depth interpolation from a coarser parent grid and had not been hand-corrected for the specific shoal, which appears on the underlying NOAA source.
By 9 May she had logged the reverse. North of Fisherman Island, a private mooring field had been expanded in 2024. The paper chart, edition 41, did not show the four new buoys. The C-MAP vector chart did, having pulled them from a USCG Notice to Mariners feed that had been integrated three months earlier.
This is, in summary, the pattern. The paper chart, when current, is more faithful to the bottom. The vector chart, when updated, is more faithful to the surface furniture: buoys, marks, restricted areas, recent wreck locations.
Neither is faithful to both.
Trenholm's other notes concern the cockpit experience itself. On the morning of 22 May, in patchy fog off Pemaquid, she found the plotter easier to read than the paper, because the plotter does not require the operator to stand up, walk below, and unfold a 36-by-48-inch sheet of paper in a confined space.
On the afternoon of the same day, with the fog gone and the sun overhead, she found the plotter screen washed out and the paper, on the saloon table, perfectly legible.
The instinct to choose between them appears, on the evidence of the logbook, to be the wrong instinct.
What seems to work is the pairing. The paper is consulted at the start of each passage and at the end. The vector is consulted at every course change in between. The lead is consulted whenever either chart shows a depth that surprises the eye.
Trenholm uses the Plath hand-bearing compass on deck to check the plotter's position against three landmarks every hour. She does this not because she distrusts the GPS but because she once, in 2019, watched a chartplotter on a friend's boat lose lock for forty minutes in a known dead zone south of Monhegan and report a position that was, by hand bearings, three quarters of a mile from the boat's actual location.
She also keeps the paper because, as she said over coffee at the float on 11 June, paper does not lose power.
The cost comparison is less interesting than one might suppose. The NOAA paper folio for the central Maine coast, ordered through OceanGrafix, ran her $186 for the season's editions. The C-MAP Reveal X subscription was $99 a year. The Raymarine plotter, amortized over its expected ten-year life, costs roughly $250 per season.
Total: about $535 a year for redundant chart coverage of waters she knows intimately. She considers this reasonable.
The deeper question, which Trenholm declined to answer with any finality, is what a single-source skipper loses. She suspects that a plotter-only skipper, working the same waters, would never have spotted the Damariscove shoal until the lead found it the hard way. She also suspects that a paper-only skipper would have missed the new Fisherman Island moorings in the dark.
Most inshore boats now run plotter-only. The folio is, in 2026, an artifact of an older generation of skippers and a smaller number of younger ones who have read enough incident reports to be cautious.
Trenholm closed the logbook in late June and brought it ashore. She intends to keep both systems running through the autumn.
Filed under