Most recreational boaters who use electronic charts do not know where the updates come from. The phrase "chart update" suggests, vaguely, that someone at the chart company has gone out and checked.
No one has gone out and checked.
What has happened, instead, is a multi-stage pipeline that begins with a national hydrographic office, passes through one or more international clearinghouses, lands at the desk of a chart compiler at one of perhaps four major commercial vector chart producers, and finally appears, weeks or months later, as a tile on a recreational plotter.
Stage one is the source. For United States waters, the source is the Office of Coast Survey at NOAA. For British and Commonwealth waters, the United Kingdom Hydrographic Office in Taunton. For most of continental Europe, a patchwork of national offices coordinated through the International Hydrographic Organization in Monaco.
These offices publish what are formally called Electronic Navigational Charts, or ENCs, in the IHO S-57 format. Beginning in 2024, many of them have begun publishing in the newer S-101 format under the broader S-100 framework.
The ENCs are the authoritative source. They are produced by surveyors with sonar and aircraft and, occasionally, divers, working under government contract.
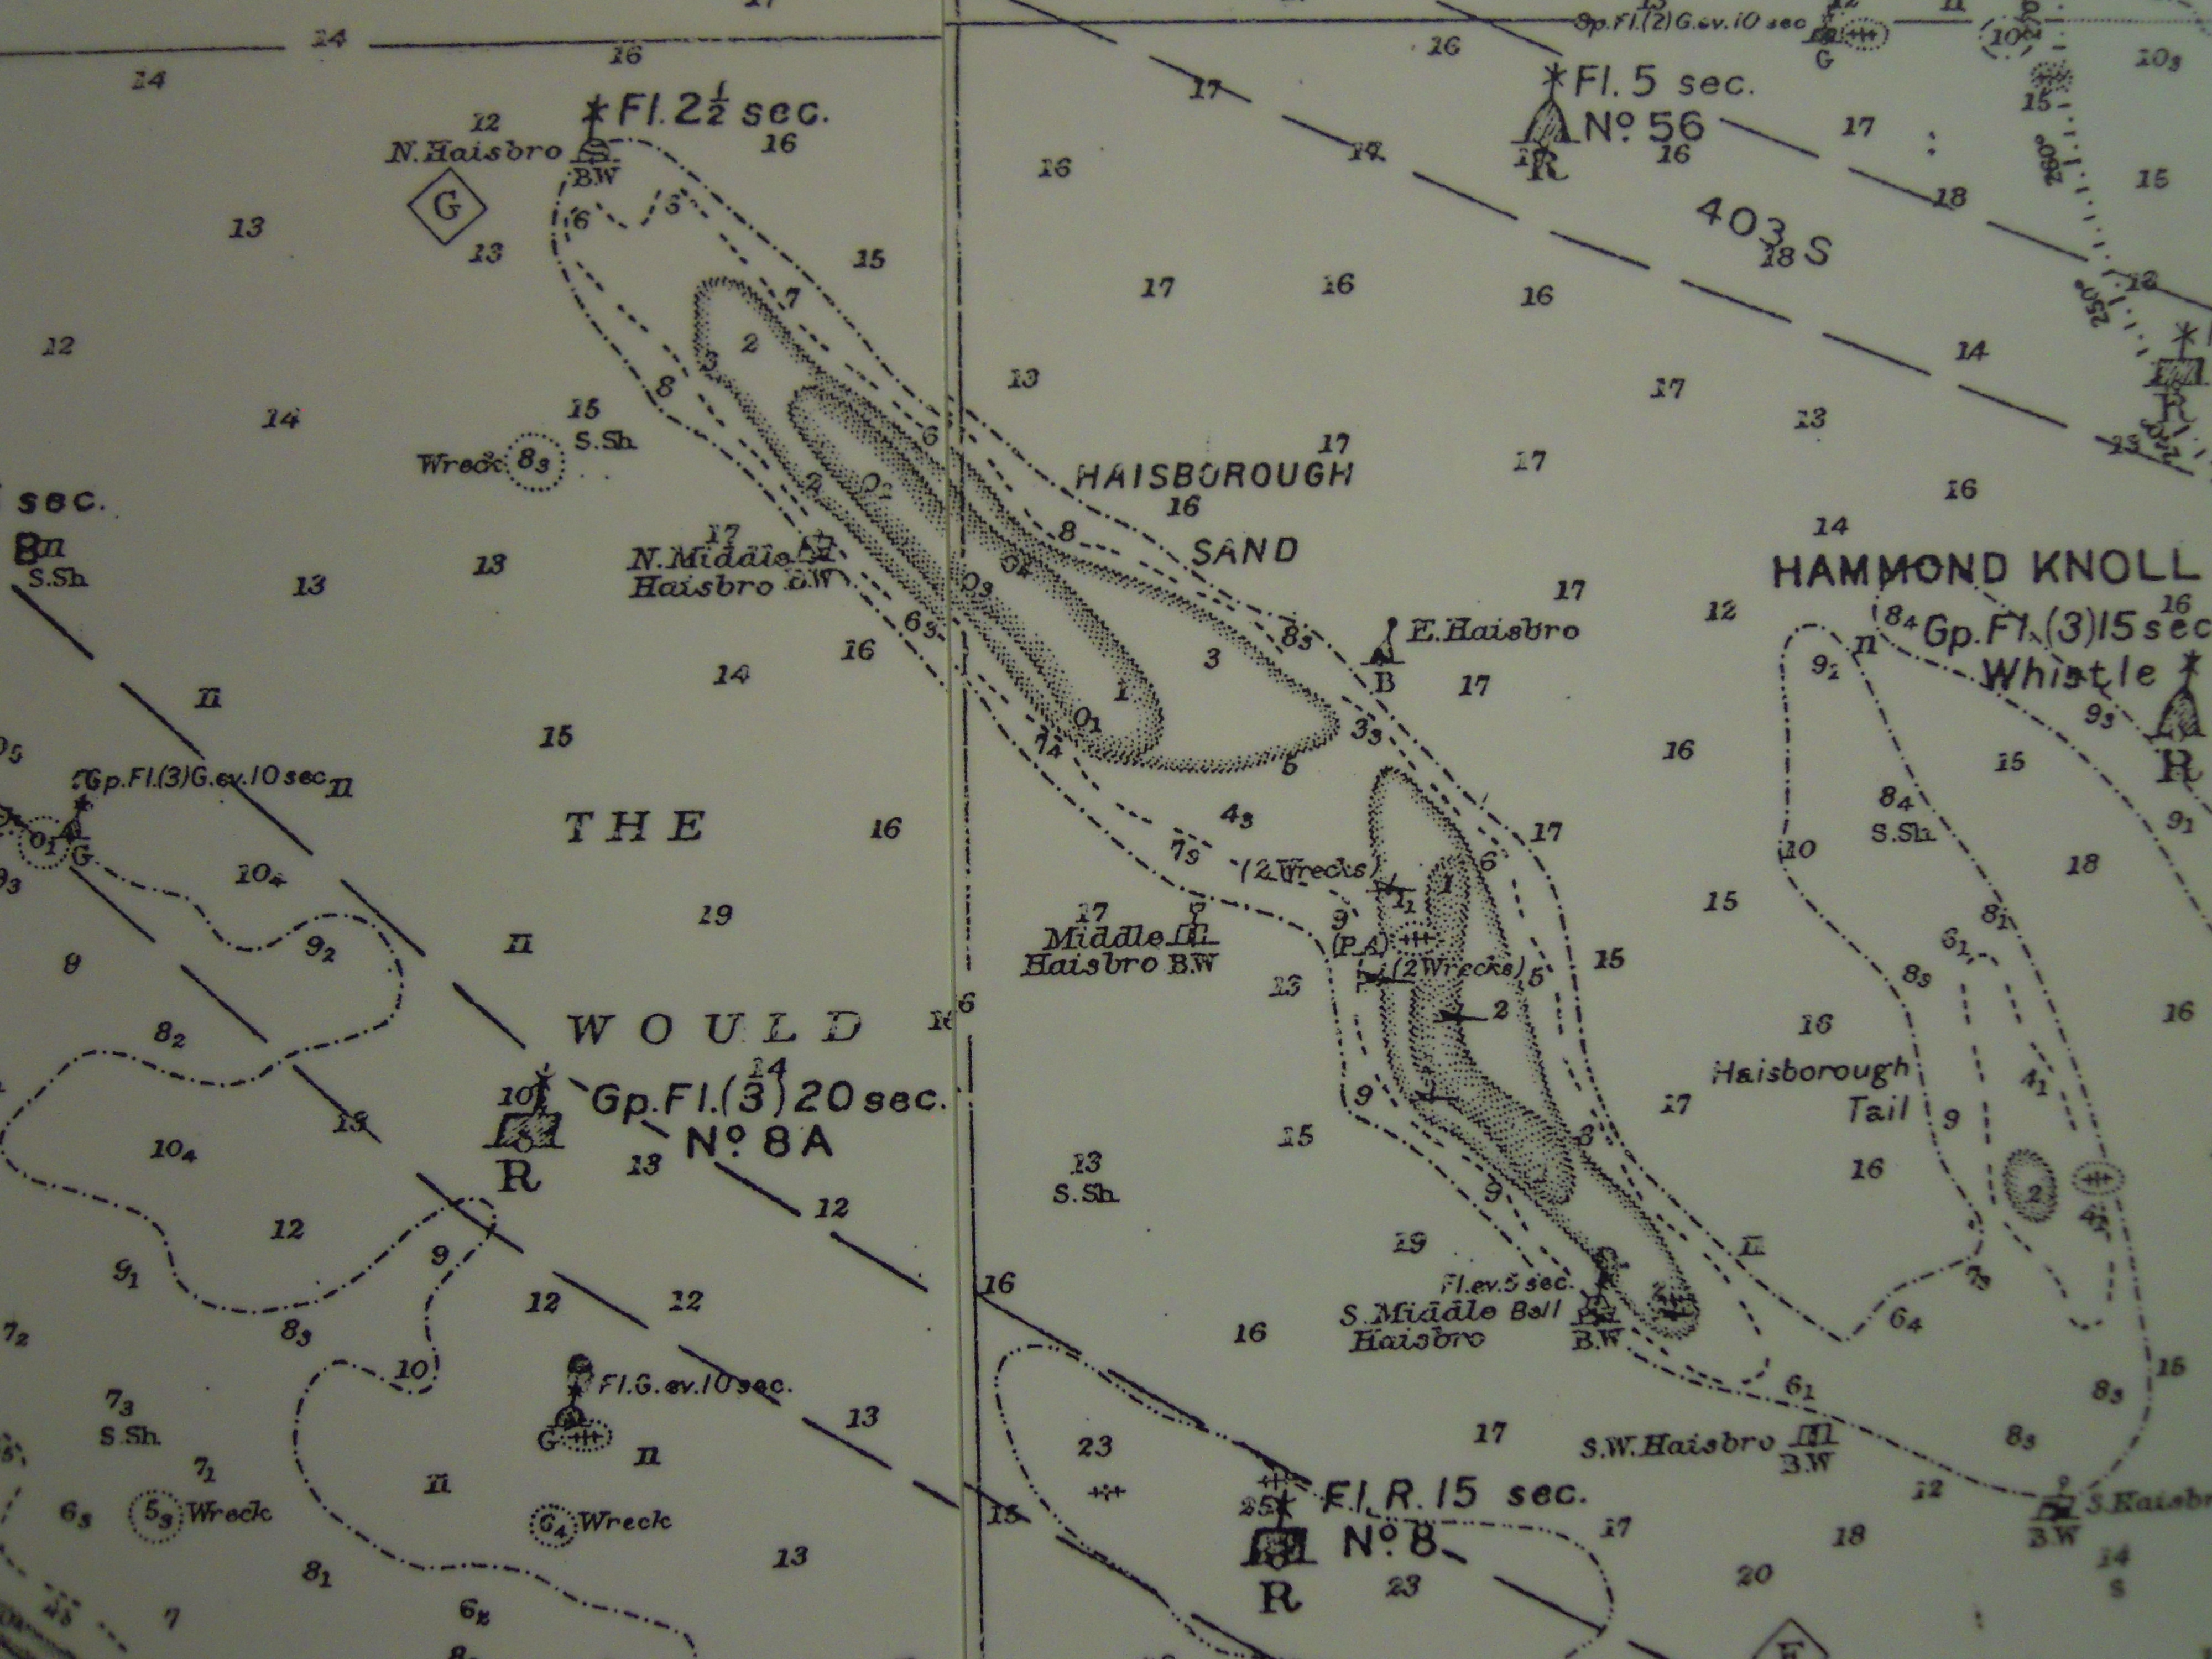
Stage two is the corrections feed. Once a chart is published, changes are issued through Notices to Mariners, weekly bulletins that report new buoys, moved buoys, decommissioned lights, new wrecks, and other navigation-relevant changes.
The Notices come from many sources. In the United States, the Coast Guard publishes the Local Notice to Mariners through each of its districts. In the United Kingdom, the UKHO publishes its Notice to Mariners. In Norway, the Kystverket. In Sweden, the Sjöfartsverket.
Stage three is aggregation. Commercial chart companies subscribe to these feeds and ingest them into their own internal databases. C-MAP, owned by Navico Group, runs its primary chart compilation operation out of a small office in Genoa, Italy, with secondary operations in Norway and Singapore.
Garmin produces its BlueChart products from a similar pipeline, headquartered in Olathe, Kansas.
Navionics, also owned by Navico Group since 2017, operates out of a long-standing office in Massarosa, Tuscany.
Stage four is compilation. A chart cartographer at one of these offices takes the ENC source, applies the relevant corrections, generalizes the data for display at multiple zoom levels, applies the company's symbology, and packages the result into vector tiles that the plotter can consume.
This work is partly automated and partly manual. The automation handles the bulk of the corrections. The manual work, increasingly, is reserved for edge cases, regional anomalies, and the integration of supplementary data sources that the source ENC does not include.
Stage five is distribution. The vector tiles are pushed to the company's content delivery network, from which the plotter or chart card downloads them.
The total latency from a buoy being moved to the change appearing on a recreational plotter is, in practice, somewhere between two weeks and three months. The variation depends on how quickly the local Coast Guard issues the notice, how quickly the chart company ingests it, and how often the user updates their chart subscription.
Most recreational users update once a year, when their subscription renews. A small number update monthly. A handful, including some commercial operators, update weekly.
The opposite end of the pipeline, the original survey, runs on a much slower timeline. A typical NOAA hydrographic survey of a heavily used port might be conducted every five to ten years. A survey of a remote section of coast might happen every twenty years, or never.
The bottom does not change quickly in most places. Where it does change, in dredged channels or storm-prone estuaries, the surveys are more frequent and the corrections more rapid.
The takeaway, for the recreational user, is modest. Vector chart updates are not a guarantee of currency. They are a guarantee that the chart company has received the most recent official notices and integrated them on a reasonable schedule.
The chart is not, and has never been, a real-time picture of the sea.
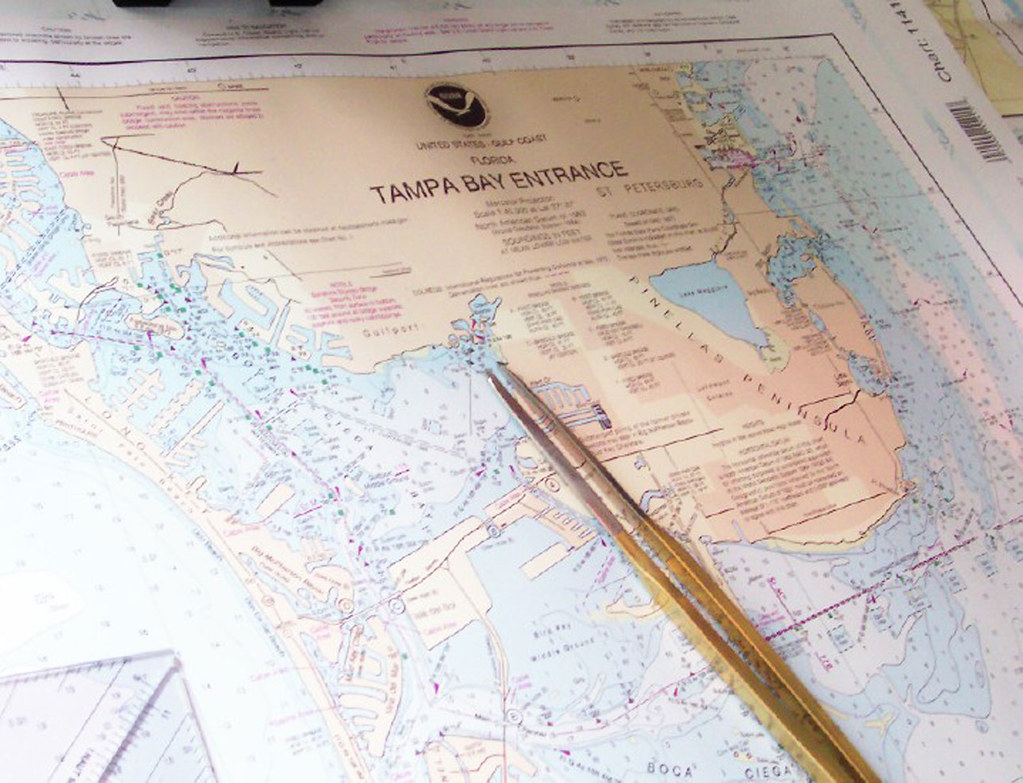
It is, as it has always been, a document. Documents take time to update. They are usually more current than they need to be for the user's purpose. Occasionally they are not.
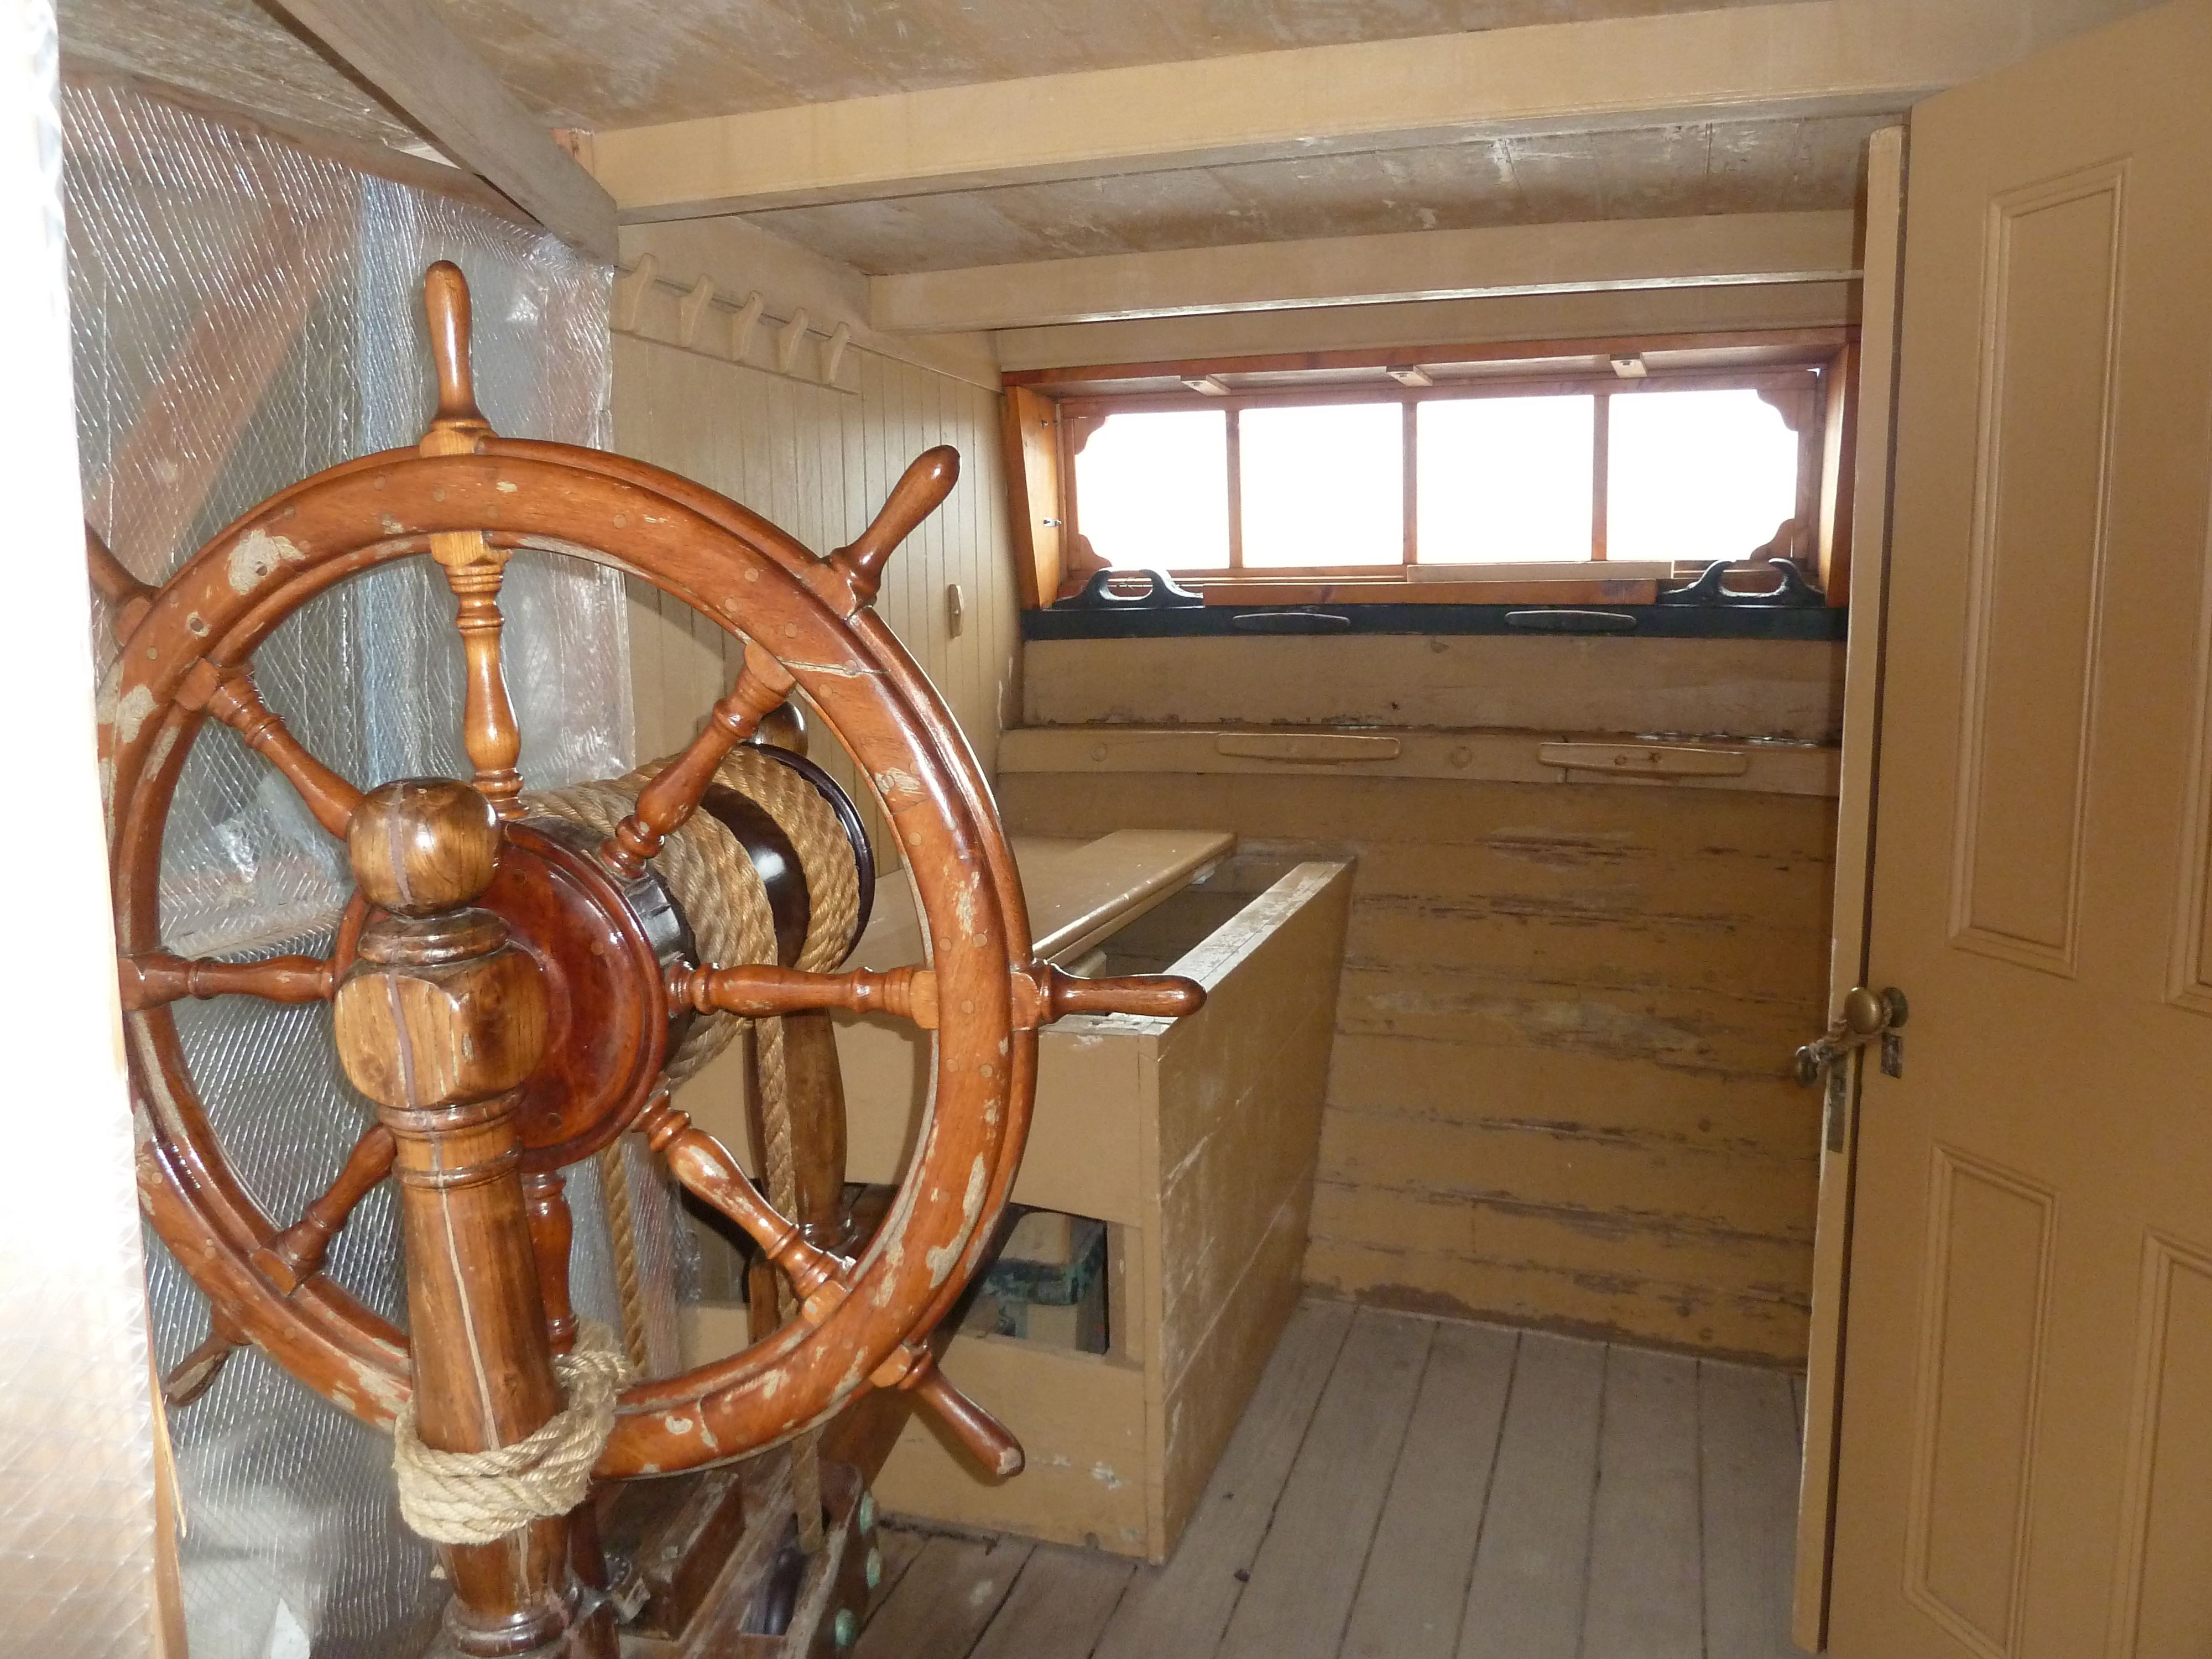
The skipper who knows this is the skipper who keeps a lead in the locker.
Filed under